Ever looked at that weird graph on your camera or editing software and ignored it completely? Yeah, that’s the histogram — and it’s your best friend in photography. Today’s photography tip (#9 in our series) is all about learning how to read a histogram like a pro.
Let’s break it down and make it simple, useful, and actually fun.
What Is a Histogram in Photography?
The Technical Definition
A histogram is a graphical representation of the tonal values of your image. In plain English? It shows how light or dark your photo is. The horizontal axis represents brightness — from black (left) to white (right), and the vertical axis shows how many pixels fall into each tone.
Why It’s So Important
The histogram helps you understand your exposure. Is the image too dark (underexposed)? Too bright (overexposed)? Perfectly balanced? Instead of relying on your eyes alone — which can be tricked by screen brightness or lighting conditions — histograms give you hard data.
Where Do You Find the Histogram?
On Your Camera
Most modern digital cameras (DSLRs, mirrorless, and even some smartphones) display a histogram either in live view or during image playback. Just dig into your settings to enable it.
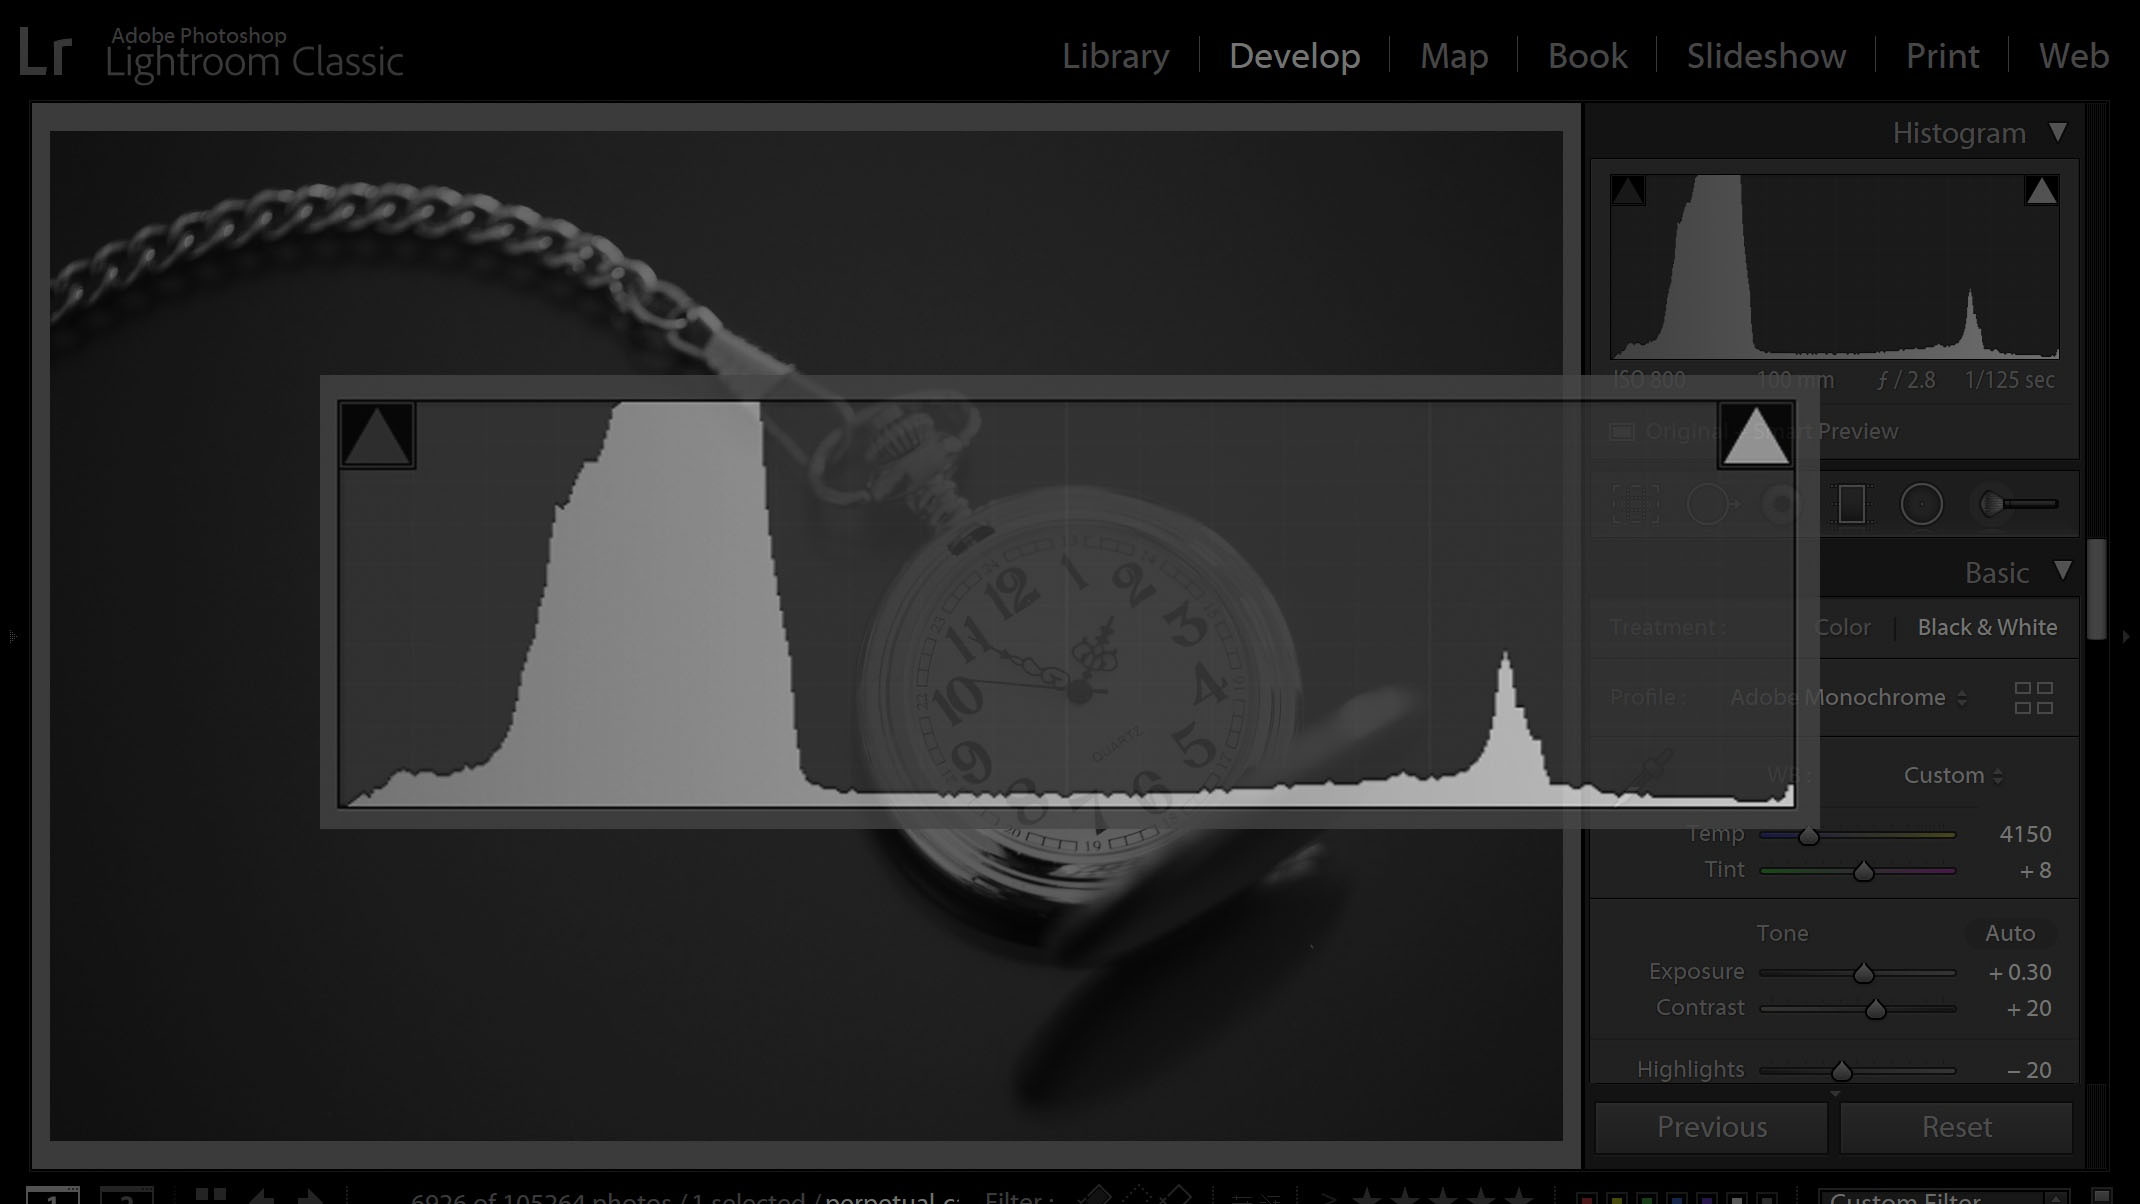
During Editing in Software
Editing programs like Adobe Lightroom, Photoshop, or Capture One display histograms too — often at the top corner. This helps you make precise adjustments without overdoing it.
How to Read a Histogram
Let’s make sense of that graph!
Left Side = Shadows
The far left represents your shadows or dark areas. If there’s a mountain of data crammed to the left, your image is likely underexposed.
Middle = Midtones
The middle part shows your midtones — think of natural skin tones, grass, sky on a cloudy day, etc.
Right Side = Highlights
All the way to the right? That’s your highlights — bright skies, light reflections, white clothes. Too much data here = potential overexposure.
Different Types of Histograms
Not all histograms are created equal. Let’s look at the two main types.
RGB Histogram
This one shows Red, Green, and Blue channels separately. It helps when dealing with color accuracy and saturation.
Luminance Histogram
This is the brightness-only histogram — simpler and often easier to read. It tells you if your exposure is on point without confusing color data.
Common Histogram Shapes & What They Mean
Balanced Histogram
This one is nicely spread across the graph. It means your photo likely has a good exposure with shadows, midtones, and highlights in harmony.
Clipped Shadows
If the data is jammed up against the left edge, you’re losing detail in dark areas — that’s what we call “clipping.”
Blown Highlights
Same thing on the right side — if it’s peaking there, your bright areas are too bright and lack detail.
Histogram Myths: Let’s Bust Them!
Perfect Histogram Doesn’t Always Mean Perfect Image
Don’t obsess over getting a perfectly balanced histogram. Some high-key or low-key images will naturally lean to one side.
Clipping Isn’t Always Bad
Sometimes, clipping is intentional. Shooting a silhouette? You want those shadows pitch black.
How to Use Histograms for Better Photography
Expose to the Right (ETTR) Technique
This technique means adjusting your exposure so the histogram data leans slightly toward the right — capturing more light and data while avoiding overexposure.
Adjusting Exposure with Confidence
By checking your histogram, you can instantly know whether to bump up or reduce exposure without guessing.
Practical Examples with Explanations
Portrait Photography
If you’re photographing a face in soft light, you’d expect a mid-heavy histogram. Watch out for clipping in highlights if you’re shooting in harsh sunlight.
Landscape Photography
Landscapes often have a wide dynamic range — histograms with data across the entire graph are common. Use your histogram to make sure you aren’t losing cloud detail or shadowy trees.
Mistakes to Avoid When Using Histograms
- Don’t blindly trust your camera screen — always check the histogram.
- Avoid exposing for the histogram only — think about the story your photo tells.
- Don’t ignore color histograms when color is critical (like product or fashion photography).
Quick Tips to Master Histogram Reading
- Practice by comparing histograms with your photo results.
- Enable the histogram in both shooting and playback modes.
- Use “highlight warning” blinkies for fast feedback.
- Zoom into shadows and highlights to inspect details.
Tools and Apps That Help
- Adobe Lightroom Mobile – Shows histograms on mobile edits.
- Camera FV-5 (Android) or ProCamera (iOS) – Manual controls + histogram support.
- Histogram+ – A standalone app for analyzing histograms in real-time.
Conclusion
So, there you have it — Photography Tip #9: Learn to Read a Histogram is one of those foundational tricks that can elevate your shots from “meh” to magnificent. Once you understand how to read this simple graph, you’ll stop guessing and start shooting with purpose.
Histograms are the GPS of your exposure journey — they guide you toward balance and creativity.
FAQs
Q1: What is the purpose of a histogram in photography?
A histogram shows the brightness levels in your image, helping you determine if your photo is properly exposed.
Q2: Do professional photographers use histograms?
Absolutely! Even pros rely on histograms to fine-tune exposure and avoid losing critical image detail.
Q3: Can I take a good photo without using a histogram?
Yes, but using a histogram ensures you consistently get better results, especially in tricky lighting.
Q4: Is a “perfect” histogram necessary?
Nope! A “good” histogram depends on your creative intent — not every scene needs perfect balance.
Q5: Should I check the histogram during or after shooting?
Ideally both. Check it in real-time to adjust exposure and again during editing for polishing.
🔍 Learn more photography tricks, gear reviews, and beginner-to-pro tutorials at CameraTale.com — your hub for practical photo knowledge.
💡 Boost your skills one tip at a time — visit CameraTale.com and make your camera your superpower.